
Measuring AI Search Visibility: The Metrics to Watch for 90 Days
A practical guide to tracking non-brand impressions, blog-to-pricing movement, and assisted signup conversions for 90 days instead of publishing more generic posts.
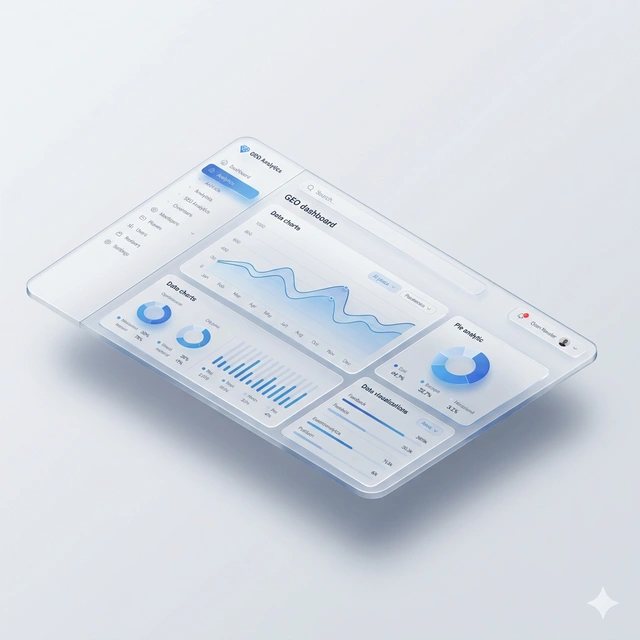
AI search visibility cannot be judged only by whether a post appears in search. For 90 days, teams should track non-brand impressions, the rate of movement from guide pages to pricing, and assisted signup conversions to understand whether guides support the revenue funnel.
- Early blog operations should stay narrow: AI search visibility measurement, AI citation and technical optimization, and before-after operating cases.
- Google provides clicks, impressions, CTR, and average position in Search Console, and in 2026 began testing dedicated reports for generative AI search features with a subset of sites.
- A 90-day measurement cycle is not only about more impressions. It should show whether guide readers move into pricing, trial, signup, or inquiry paths.
Google Search Console Help explains that performance reports show clicks, impressions, CTR, and average position.
Google Search Central announced in June 2026 that dedicated generative AI search performance reports were rolling out to a subset of sites in Search Console.
Naver Search Advisor describes RSS and sitemaps as content feeds that help actively inform its crawler about important site URLs.
1. Start with only three blog metrics
The common early mistake is measuring views, publishing volume, and keyword count all at once. A new service blog is unlikely to create meaningful search traffic immediately. For the first 90 days, it is better to limit measurement to three metrics: non-brand search impressions, movement from guide pages to pricing, and assisted signup conversions.
Non-brand impressions show whether users who do not already know the brand discover the guide through problem or category searches. Queries such as AI search visibility measurement, GEO optimization, or AI citation tracking are closer to problem awareness than branded demand. Branded queries should be separated because they reflect users who already know the company.
The blog-to-pricing rate shows whether a guide moves users from education into product evaluation. Assisted signup conversion captures cases where the blog was not the last click but contributed to signup, inquiry, or purchase within a defined window. When these three metrics move together, the blog becomes more than content; it becomes a conversion-support asset.
- Non-brand impressions: search impressions excluding brand, domain, and product-name queries.
- Blog-to-pricing rate: sessions moving from an article to pricing, signup, or trial paths.
- Assisted signup conversion: signup or inquiry within 7 or 30 days after a guide visit.
- Operating decision: if none of the three metrics moves after 90 days, consider hiding the nav entry while preserving existing URLs.
2. Search Console and the dashboard have different jobs
Search Console is the baseline tool for understanding how often users saw and clicked a site in search. Google describes clicks, impressions, CTR, and average position as core performance-report metrics. In June 2026, Google also announced dedicated generative AI search performance reports for a subset of sites.
Search Console alone does not explain how guide readers affect product conversion. A GEO Gateway dashboard should connect article URLs, pricing visits, signup starts, completed signups, and AI request logs. If search impressions grow but pricing movement stays flat, the CTA or article structure may be weak. If pricing movement grows but signup does not, pricing or trial explanation may be the friction point.
Naver should be measured separately. Naver Search Advisor describes RSS and sitemaps as feeds that inform crawlers about content URLs. For Naver, teams should track crawl requests, sitemap status, RSS submission, and whether the page appears in Naver results separately from Search Console.
- Google: review query, page, country, and device-level impressions and clicks in Search Console.
- Naver: check RSS, sitemap submission, crawl request, and site diagnostics in Search Advisor.
- GEO Gateway: connect article-level pricing movement, assisted signup conversions, and AI request logs.
- Dashboard standard: compare search visibility and product conversion in one report.
3. Owned data starts with stable definitions, not inflated numbers
Before enough owned data accumulates, teams should not invent performance numbers. They should publish the measurement definition first and compare before-after results against the same baseline after 90 days. The owned-data fields in this guide are non-brand impressions, blog-to-pricing rate, and assisted signup conversions.
The collection rules must be explicit. Non-brand impressions exclude brand name, domain name, and product name queries. Blog-to-pricing rate is based on events from an article page to pricing, signup, or trial CTAs. Assisted signup conversion groups sessions that generate signup within 7 or 30 days after a blog visit.
Stable definitions reduce vague judgments such as “we are not showing up.” Teams can see whether a post receives impressions without clicks, clicks without product evaluation, or product evaluation without signup.
- Separate branded queries into a different group.
- Fix events for article-to-pricing, article-to-signup, and article-to-trial CTA clicks.
- Track 7-day and 30-day assisted signup conversions separately.
- Compare updates before and after using the same dashboard definitions.
4. After 90 days, judge operating viability, not publishing volume
One article per month may look slow, but articles with real product screens, authors, reviewers, modified dates, source citations, and measured outcomes take operational effort. With that standard, publishing less and updating consistently is safer than publishing many weak posts.
If non-brand impressions, blog-to-pricing rate, and assisted signup conversions do not move after 90 days, deleting the URLs is not the safest answer. Keep existing URLs and reduce only top navigation exposure. If at least one metric improves, strengthen the same topic cluster with follow-up guides.
The point is simple: a blog is not a publishing channel by itself. It becomes a marketing operations asset when publication is followed by search-engine submission, crawl checks, dashboard measurement, CTA refinement, and modified-date updates.
- No performance: reduce top navigation exposure while keeping existing URLs.
- More impressions but low clicks: refine title, description, intro, and search intent.
- More clicks but low conversion: improve pricing-path CTA and trial explanation.
- Assisted signup exists: create follow-up guides in the same topic cluster.
Turn this checklist into your first AI View.
For 7 days, test AI View creation, AI request monitoring, and traffic and conversion tracking inside GEO Gateway.
Start your 7-day free trial